17 nov 2014

INTEGRATION OF SOCIAL NETWORK ANALYSIS IN GEPHI AND TABLEAU ANALYSIS  (CCK11 DATASET)


The data were taken from CCK11 dataset provided in the course.

The finding are:

Closeness: There are 15 participants that are highly connected to others within their own community. Participant's ID 111,118,116,117,138...(see the graph).

Betweenness: There are 15 participants that highly act as bridges between communities in the blog. Among them, participant 3 and 10 are the most famous connectors.

Modularity: There are seven (0-6) communities conformed in the blog. The community 2 has the most participants and the community 4 has the least ones.

Betweenness/Modularity: Group 0 has two main connectors between communities. They are participant 25 and 3. / Group 1 has two main connectors between communities. They are participant 64 and 9. / Group 2 has five main connectors between communities. They are participant 10, 11, 17, 18 and 20. / Group 3 has two main connectors between communities. They are participant 60 and 15. / Group 4 has one main connector between communities. It is participant 78. / Group 5 has one main connector between communities. It is participant 109. / Group 6 has one main connector between communities. It is participant 112.




13 nov 2014

HANDS-ON ACTIVITY: INTEGRATION OF SOCIAL NETWORK ANALYSIS IN GEPHI AND TABLEAU ANALYSIS 
  • Export the results of social network analyses (centrality and modularity) of the networks available in theexample dataset from Gephi – via the Data Laboratory tab of Gephi – in the format (i.e., CSV) that can be imported into Tableau
  • Plot the data to show the distribution of each centrality measure for each of the two networks
  • Plot the data to show the distribution of centrality measures across communities identified in each of the two networks
I am not sure whether I accomplished this assignment. I need your feedback.
 

9 nov 2014

HANDS-ON ACTIVITY: VISUALIZATION OF THE RESULTS OF SOCIAL NETWORK ANALYSIS IN GEPHI (EXAMPLE DATASET)

    • Explore different layouts for the representation of the network (e.g., Fruchterman Reingold and Yinfan Hu) and experiment with their configuration parameters
    • Size the network nodes based on centrality measures
    • Size the network edges based on their weight
    • Explore how to visualize the labels of the network nodes and edges
    • Used different color to visualize the communities identified in the networks

HANDS-ON ACTIVITY: IMPORT THE CCK11 DATASET INTO GEPHI AND PERFORM SNA ANALYSIS METHODS

  • Compute the density measure of the networks
  • Compute centrality measures (betweenness and degree) introduced in the course
  • Apply the Giant Component filter to filter out all the disconnected nodes and identify communities by using the modularity algorithm.
Assignment Week 3:

IMPORT THE DATA SET INTO GEPHI AND CALCULATE THE SNA MEASURES

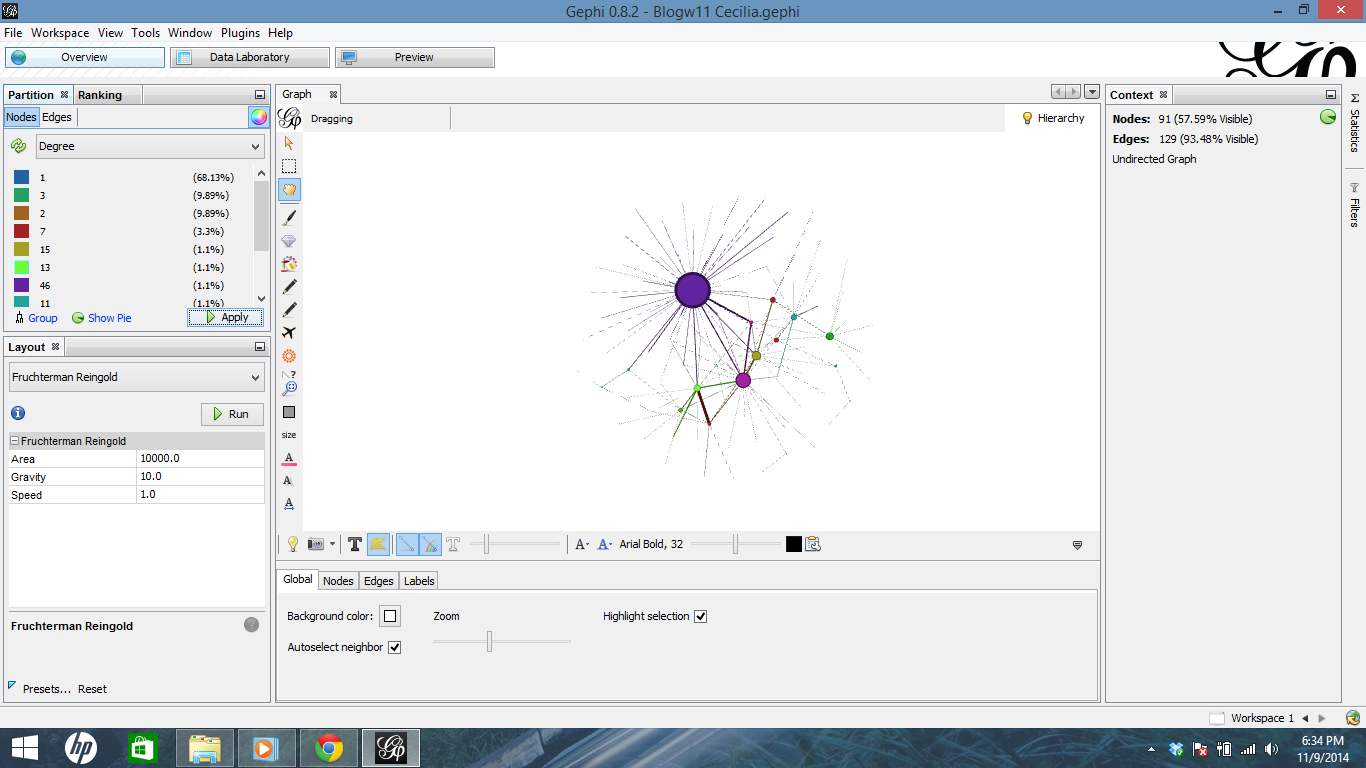
These are my screenshots of my Gephi practice. I got the visualization of degree, centrality, and modularity.

6 nov 2014

ASSIGNMENT: REFLECTION AND DISCUSSION ON SOCIAL NETWORK ANALYSIS    
  
1. Outline your understanding of social network structure and main methods for social network analysis (centrality, density, and modularity)

According to my understanding, social network analysis is a kind of measurement among connections between actors (called nodes). The measurement can be made using the following analysis:
-Diameter: it measures the longest distance among actors related in the network.
-Centrality: it indicates what actor has more connections in the network.
-Density: it indicates how close the actors are to each other.
-Modularity: analysis of groups and sub-groups related to each other as well as of those who are not part of the group in the network.

2. Discus potential benefits of the use of social network analysis for the study of learning and learning contexts

In the case that my class is based on participation, one of the benefit I see projected is to understand visually who is the leader or expert in my classroom and who knows more about certain content. I could also see who is not participating in the network. In this way I may take action of what is happening and help no-participants to interact each other.

3. Describe potential applications of social network analysis for the study of learning. Reflect on the methods that could be used for data collection, steps to be taken for the analysis, potential conclusions, and possible issues (e.g., incomplete network, triangulation with other types of analysis, or ethics) that would need to be addressed in the process. 

In education I can apply social network analysis to see how my students are related each other in order to share ideas, materials, or study for an exam.
If I want to see interaction among my students considering their learning style as a point of interest, I would use modularity. The idea is to perceive whether different students’ learning style are conforming different network inside my Facebook page.
The goal to measure modularity is to take in account the groups created on Facebook to ask them to work together in a project and give to the leader (central point) the responsibility to conduct his/her group. 

1 nov 2014

Practicing with Tableau

This is a screenshot of my trying of using Tableau. As suggested by professor Siemens in his analytics model, it is crucial to clean the data in order to analyze it and obtain the most significant visualization. In particular, I was lost using Tableau with my own data, but I know that with a clean database I will get it soon.